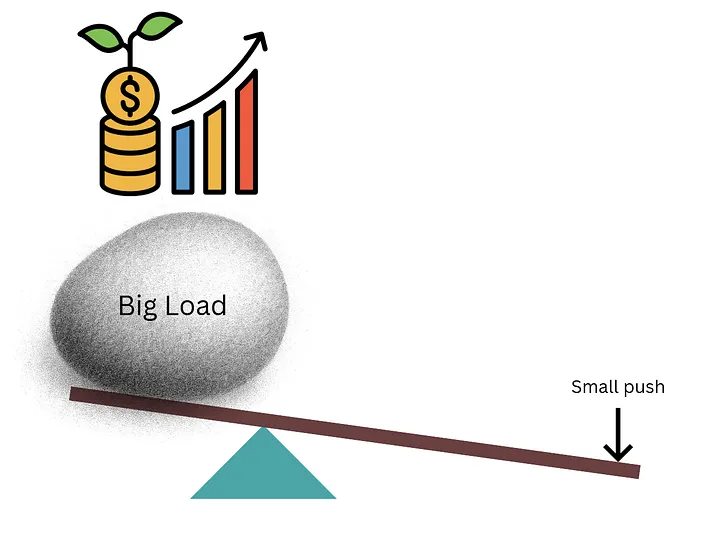
Financial leverage allows you to use a small effort (a tiny amount out of your investing funds) to generate a much bigger push upwards for your portfolio.
But growing with leverage is not obvious.
Its not like a common investor (like you and me) can borrow money like Elon musk to fund his portfolio/venture.
So you might have felt disadvantaged …… until now !
Strategic leverage is definitely possible for an ordinary investor as well. We will cover how, what returns are possible, and are there any caveats.
The trick is to focus on leveraged ETFs.
This article will describe how best to do that, and what returns are possible.
How does it work
A leveraged ETF uses derivative instruments (like options, futures and swaps), to give 2x or 3x returns of the normal index, inone day.
The one day thing is important. It is not the intent of the leveraged fund to provide a long term 2x or 3x return. They only match to returning the leveraged return, on a daily basis.
With that said though, leveraged ETFs have had a stellar history. Particularly in the technology sector. Have a look at the 3x leveraged TQQQ, which tries to amplify the NASDAQ , tech index.
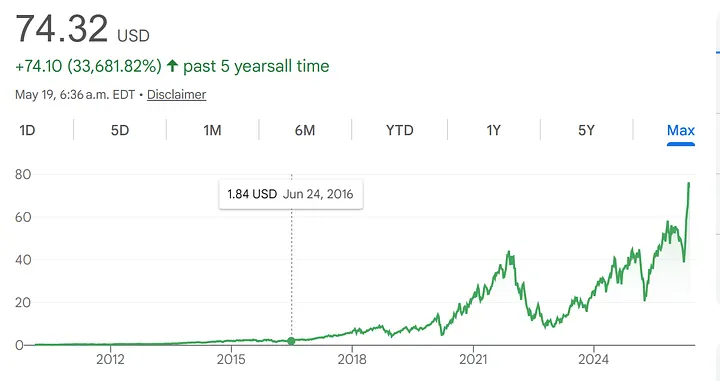
Starting around 2010, it had had a stellar run. How stellar ? The above chart gives some qualitative feel, but lets run the numbers each quarter, to see what the CAGR for this ETF has been, for someone merely holding.
Performance over 10 years
We start in the first quarter of 2011, and go until 2026. Here is the sampling of prices every quarter, and a compounding curve running through them
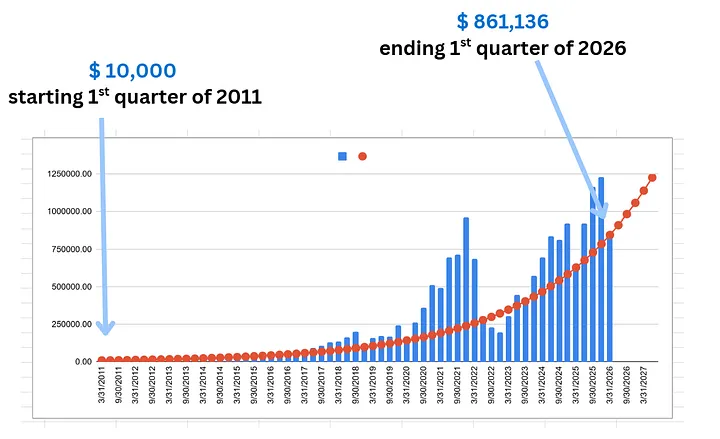
This is a massive 80X return on original investment. Its unheard of, in investing history, just for holding a single ETF.
What is the price of this massive performance ?
Stomach churning volatility.
At one point, you had a drawdown that took a 960K portfolio to 190K. A nearly 80% slashing of value.
Such volatility might look palatable on a graph. But its almost certain very very hard to live through.
The red line
In the figure above, the quarterly prices have been overlaid with a smooth red curve.
The red curve is the inferred growth curve, to get rid of the very big variations in the high volatility index.
Once the red line has been fitted, we can then read the growth rate of the index, from the rate of the red curve.
We have transformed what was a random price fluctuation, into a definitive number. The next section will show what that number is.
What returns are possible
Once the red curve has filtered out the noisy variations in the price data, we are ready to know what the actual growth rate of the ETF maybe.
Now remember, this growth rate (that we will find out) is for people who bought the ETF a while ago, and held along.
Most of the advice on internet will tell you: “Do not hold a leveraged ETF long terms”. So in some real sense, this is a contrarian measurement. We are going against the grain of general internet/public opinion. And saying that you can meaningfully get portfolio acceleration just by holding on to a leveraged ETF long term. What makes us say that ?
Because when we look at the pricing data, we clearly see that it hugs the compounding curve. It coils around it, sometimes going above, then under, then above again and so on. It looks like a mean reverting signal. And mean reversion tells us, that the average growth rate is trending upwards, as shown by the red compounding curve.
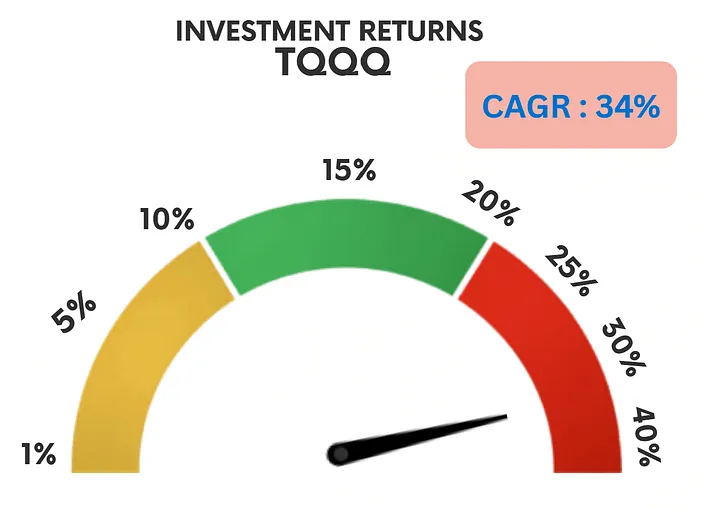
If we look at the CAGR of the red curve, with the noise filtered out, here is what it yields.
Compare it to the growth of a normal unleveraged SPY fund
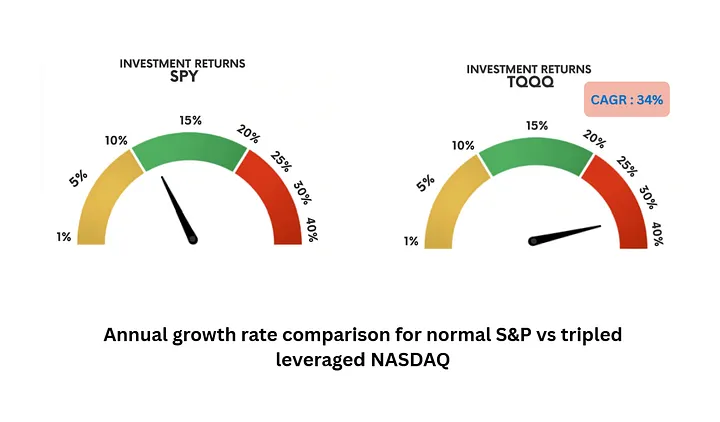
Normal SPY fund yields a little over 10%, while the triple leveraged fund yields a whooping 34% CAGR. The comparison is quite startling.
Comparison of 10% vs 34% rate
Just to drive the point home, of how huge of a deal this compounding rate is, we simulate two scenarios. A 100k investment, into a fund yield 10% return a year, and another fund yielding 34% return a year. Here is what the 10% fund gives …
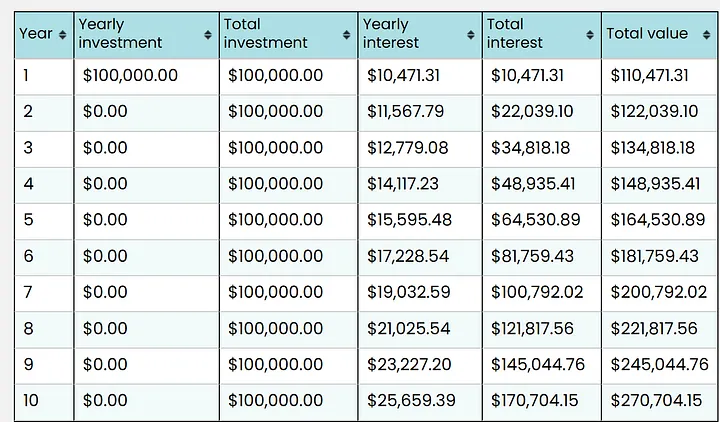
At the end, you have a sum of 270K meaning the money has been multiplied nearly 3X.
And now for the kicker !
This is what happens when you up the growth rate to 34% a year.
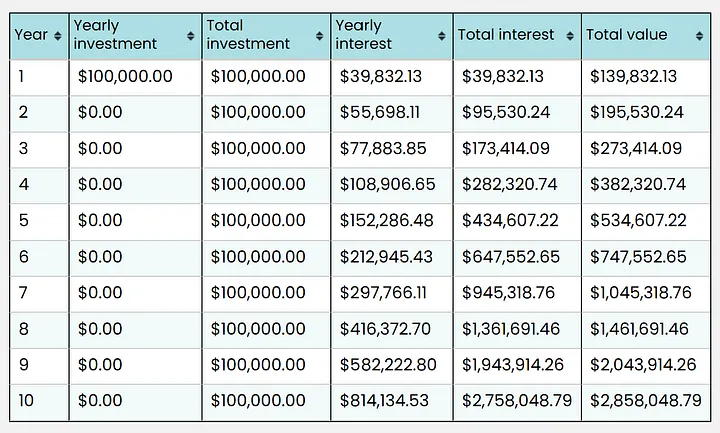
Instead of 200k+ for the 10% rate, you get 2 Mil+ with the 34% rate. This is a mind numbing comparison of compounded nonlinear growth.
Takeaway Notes
Leveraged ETFs can add unbelievable oomph to your portfolios, provided you can handle the volatility.
Even the normal market volatility, is hard to handle for most DIY investors. Leveraged ETFs take this to a whole another level.
To handle the intense psychology associated with leveraged ETFs, you need a more calibrated, a more quantitatively flavored tools. Why ? Because compounding is nonlinear (curved), and nonlinear growth rates are hard to wrap your head around. So you can get overwhelmed very quickly.
Such a tool can help inform you, on where the index (stock) will stand at any given time in the future, with a certain assumed rate of compounding.
If you think a quantitative tool to handle a leveraged ETF will help you, please let know in the comments.