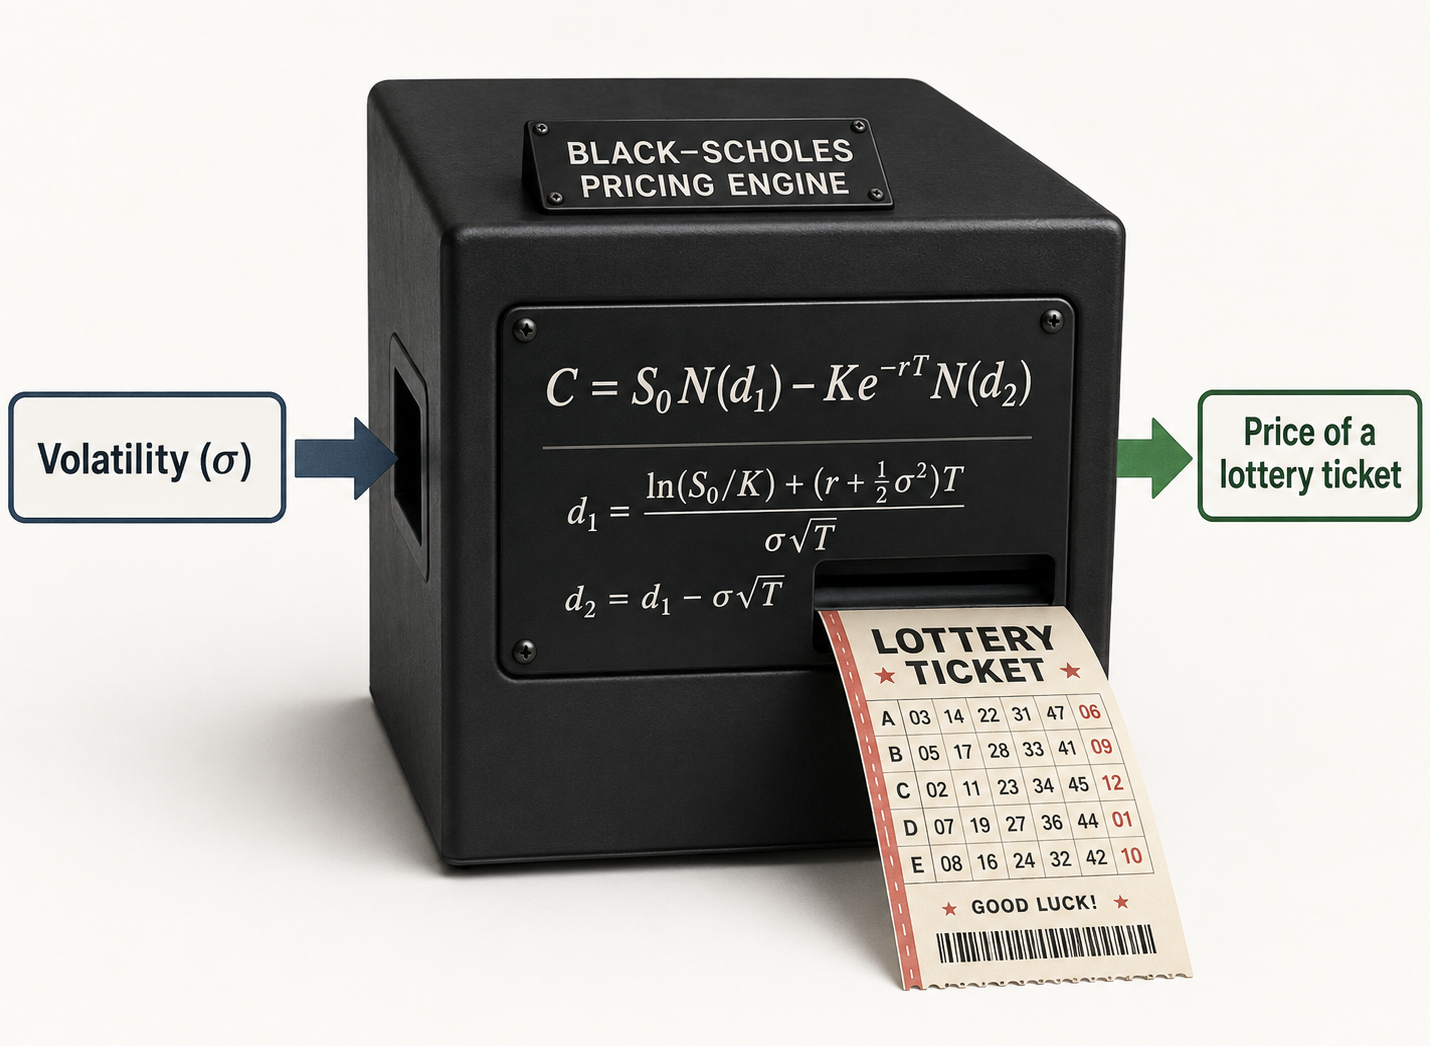
Note: The written text in this article is entirely my own (no AI whatsoever). GPT has been used to create some numerical illustrations to show calculation of certain formulas. Those appear as images in the article.
Ever thought about printing lottery tickets at home and selling them ? Might sound a bit childish and foolish in the first go, but hear me out.
Something called a black-scholes pricing engine, can print lottery tickets for you. You can buy (someone elses tickets), or you can sell your own, or you can do both. All this from the couch in your living room. Its one of the most remarkable machines conceived by humans (creators won Nobel prize in economics), and its entirely built out of those math expressions you saw in the picture above. ! Is it not remarkable?
In this article we will see how to operate the machine, and how best to feed it raw inputs to generate those tickets.
The lottery tickets it creates are called options. Anyone can make them, at will. Learning about these tickets (i-e financial options), gives you two cool skills:
- Manage your finances and investments with greater control
- Take some of the financial worries of mini-retirement and soften them with a pseudo-steady income
Options work on this idea of volatility. Volatility in its essence, is the ‘potential’ baked into the stock, or index fund.
The Why of volatile stocks
A very volatile stock (or index or sector) is something people are unable to make their mind about. What happens to it. How will the forces in the world shape it. And conversely : How will it shape the industry and world around it.
Case in point : Semiconductors. Ever since the remarkable onset of AI, semiconductors sector, (which has more or less always been historically hot), reached a new sphere of stardom. Its a technology that has a lot of volatility around it (signified by Nvidia’s stock jumps). But volatility means potential. Potential to explode higher. Or, a (negative) potential to go into a dump.
Similar thing for other sectors that have been hot through history. Computing, software, internet, telecommunications, social media, etc etc. The stocks in these industries were wild, because of the potential surrounding them. Options offer us a way to siphon some of that potential into income.
Mechanics of volatility calculation
So how do we measure ‘potential’ a.k.a volatility. That is not very complicated. Its just the standard deviation of returns over a certain window. Here is the brief run down (from GPT).
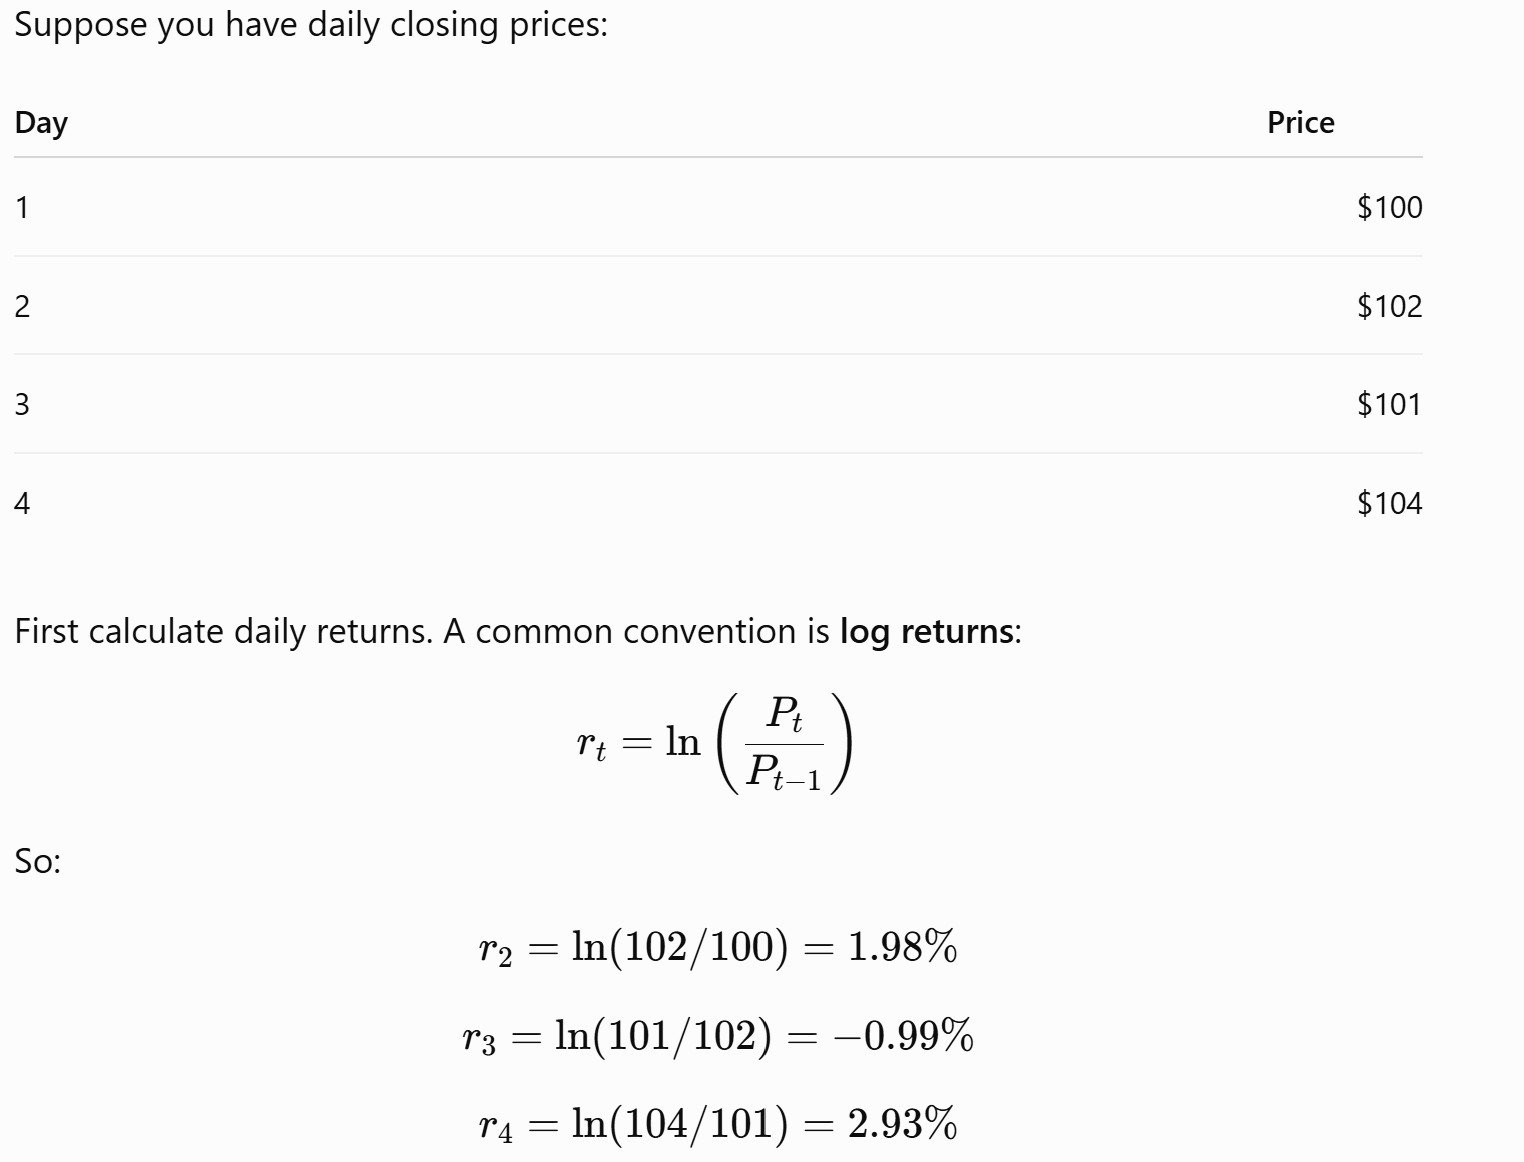
After you have the daily returns, you simply calculate the standard deviation of them.
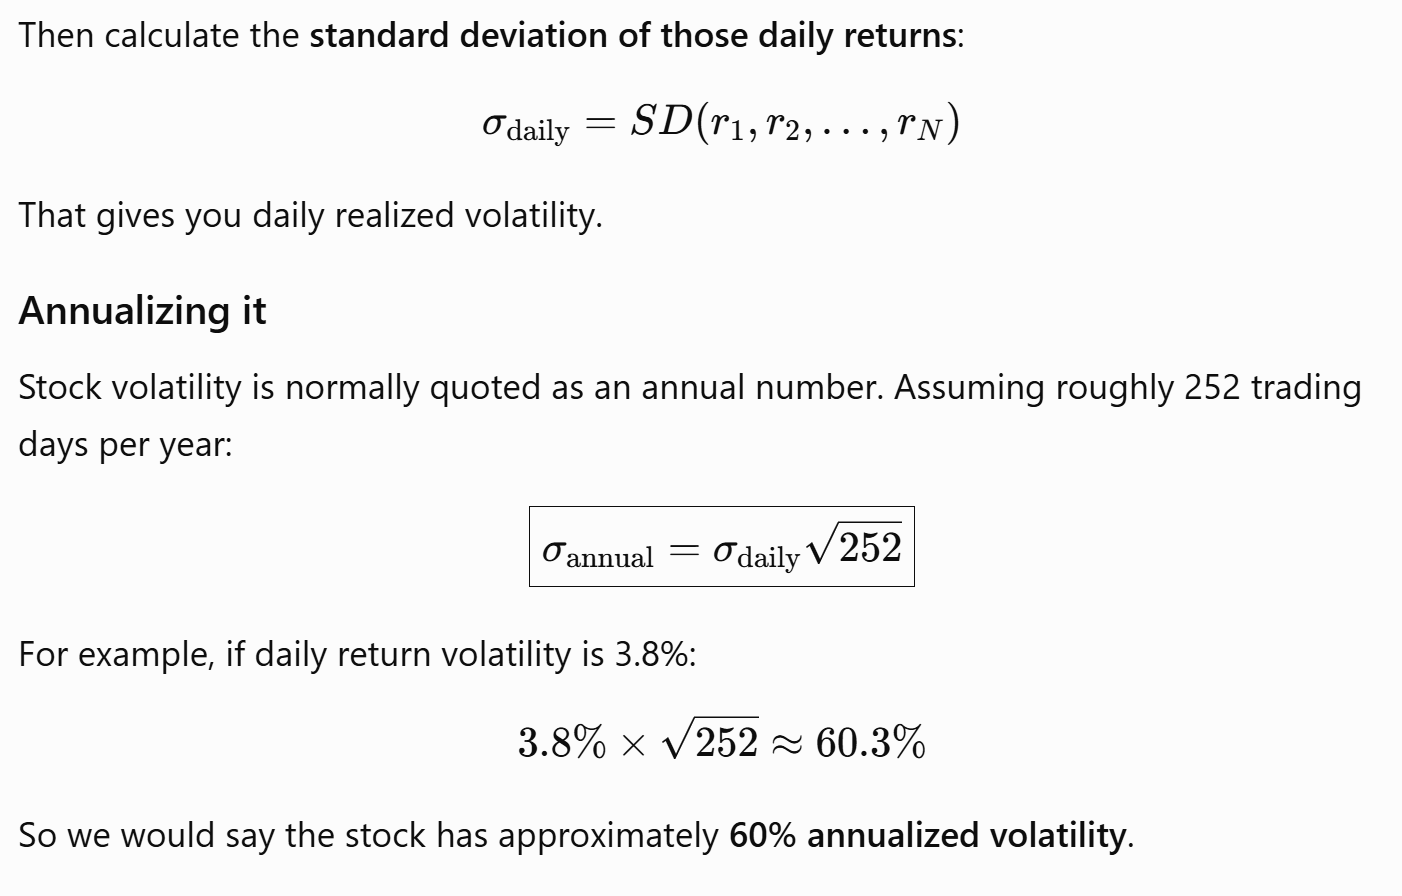
We use the square root, because variance when calculated, squared the returns. Squaring is needed because positive and negative returns can be neutralized to just a positive number.
Now what does this 60% mean ? It means the same as what the calculation did in the forward direction, but taken backwards. It is saying that the price fluctuation for the day is roughly 3.8%. This is what you should expect, in a day. It is quite high. That is because the volatility is high.
Why does something like standard deviation tell us of the stock potential ? That is indeed an interesting question. I like to think of deviation, or the average deviation, as a proxy for people making up their mind. Higher the deviation, higher the difference of opinion between different market participants. And the difference of opinion exists, because the potential of that technology / stock / sector is hard to pin down, hard to calibrate. So higher the average difference of opinion, higher the potential.
Benchmark volatility
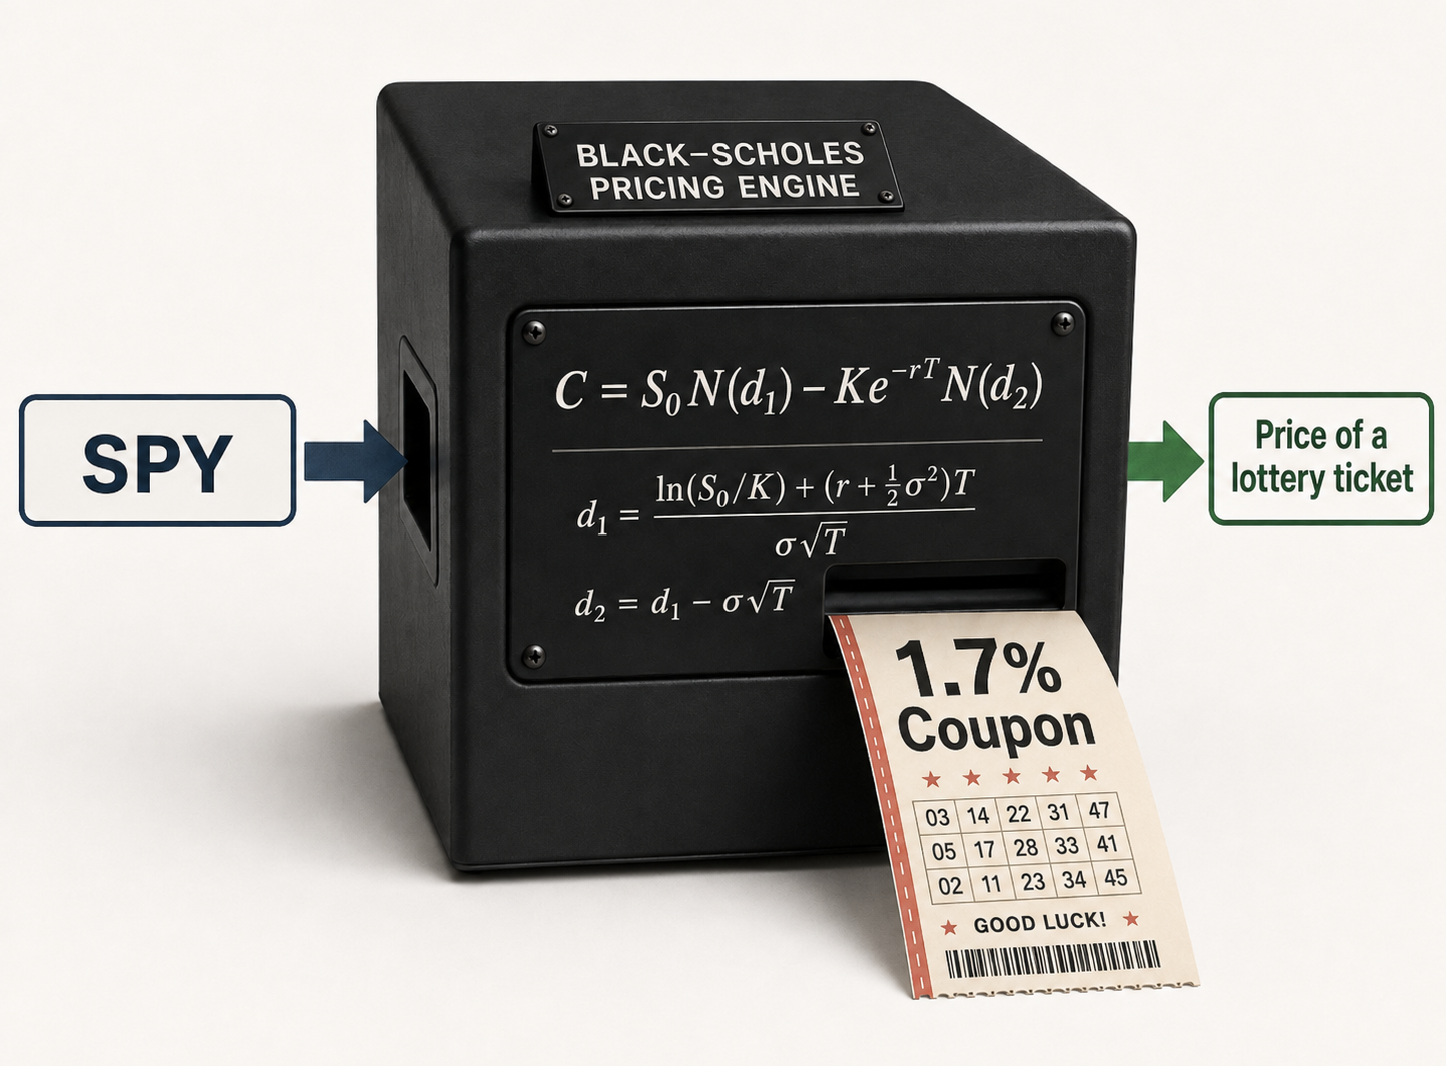
What is an example of low volatility. Or your average volatility. S&P index (represented by SPY, mirroring 500 US companies) gives us one benchmark of volatility. S&P has generally held the volatility from 10–15%. That is almost the baseline benchmark we can start from. If you feed SPY into the machine, you can get a 1.5–2% monthly return coupon.
Now the volatility changes. All the time. Based on price movements, as we saw. So there are volatility regimes. Below, I plot the volatility distribution of SPY, the popular S&P index fund.
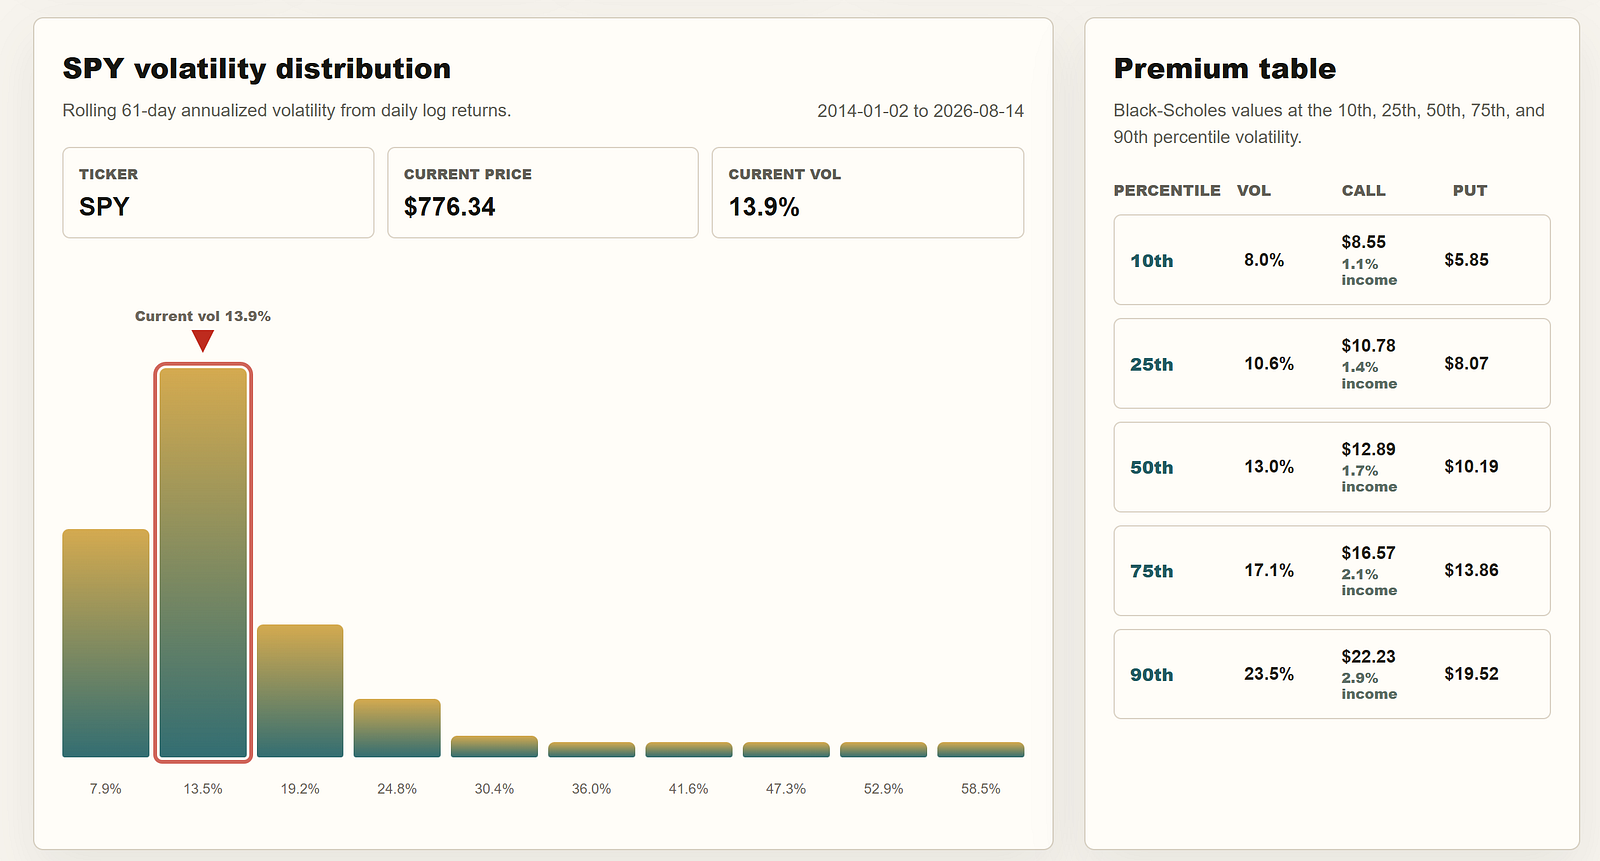
The histogram on the left is the proportion of all the volatilities SPY experienced based on its price movement. The red arrow and the encircled bin show the current volatility bin.
The table on the right shows different percentiles of volatility in the numerical form. For example, looking at first row, the lowest 10% of volatilities were around 8% mark. Meaning, for 10% of the time, the index showed a volatility of 8% (rough interpretation).
As we can see in the second column, the volatility ranges from 8% at the 10th percentile, to 23.4% at the 90th percentile. The 50th percentile is at 12.9%. The third column (the main guy) shows us how much will the monthly call option (a lottery ticket on this index going higher) will cost at the current SPY price of $776.
Lets say you printed the ticket, and sold someone this lottery (by selling to open a call in your brokers account), you will make a 1.7% per month of premium income, for selling the ‘potential’ of this stock (look at small print underneath the 12.9 dollar price). That's not a bad income. A 100K portfolio can generate a 1700 per month in income, from selling these little tickets.
What will you make ?
Will you make exactly 1.7% ? That is where the caveat comes in. Yes, you will make 1.7% on this transaction. The money will be deposited in your account, and everything is locked and secure. But to sell this option, you need to have brought 100 units of the stock. And that capital is now sitting in this stock. That capital is at risk.
The capital sitting in the stock used to print the ticket, is a capital at risk.
What is exactly the risk ? Our frenemy, volatility again. You can experience variations in the day to day price, and week to week price, determined by the volatility of the underlying, that is 12.9% (annually). So depending on whether the stock rises or falls, you can loose ‘paper’ money. If it falls, you will have less sitting on the account.
Or the stock goes higher, gets called away, (by the buyer of the ticket). You loose the stock, (not loose money, but loose the stock) and you will have to buy the stock at a higher price, to print another ticket to sell. That extra money being plowed in, to keep the ticketing engine running must be accounted for somewhere.
That's where things get a little hairy. Volatility allows us to print those tickets, with a certain payment coupon. We will get that payment. But to gather those payments, you are putting yourself at risk. Risk of decrease, as well as the risk of increase. Your ideal place is that the stock neither goes up, nor goes down. Then you can just keep harvesting volatility. But that would almost never happen by definition ! Why ? Because the volatility itself will die down, if the stock never moves !! Realizing this, always breaks me into a smile. The fact that you can harvest premium, exists only because the stock moved and whipped and struggled back and forth in trying to find its direction (up or down). And because it struggled, it had potential ….. it had Volatility !
One little caveat
The volatility we calculated from price data is called realized volatility. ‘Realized’ because it was a signature already present in the price data. A close cousin of this is implied volatility, or IV. IV is the volatility that is implied by the price of the option in the open market. The option buyers and sellers do not always use the black-scholes predicted price. The price in the market is determined by forces of market supply and demand. It is almost always higher than the realized volatility price. This is called volatility premium. And the volatility premium is a psychological premium, that the market is willing to pay, to play with the fire and water of speculation and safety. In other words, the actual price of the lottery tickets, will always invariably be slightly higher than the prices calculated by using historical pricing data.
Your income engine
But in general, the volatility distribution like the one shown above, gives you a good idea. An idea about where the current volatility sits with respect to its historical counterparts. This is very important when making a decision on using this income generating mechanism. A current volatility that sits in line with the historical volatility (like in the case of our example) is a good thing. This means the volatility, and the volatility premium (or option income) are in line with this historical averages. If the volatility is elevated, and we are either in the very low or high volatility regime, the ticket-ing press might need a re-think.
Using a few rules, couples with some intuition of how the market forces behave, you can build your own income engine, or ticketing press. If one learns how exactly to build a machine for creating this kind of income, its a point of enormous amount of leverage. Its not just that you will be able to make money. The key is that you will be able to generate income, on your own terms. And on your own terms simply means that you will have a precise control and knowledge of the risk that you are putting on your capital. You will not be at the mercy of pundits who keep proclaiming the market is at an all-time high, and just about to go down. In any market regime, whether its going up or down, you will be able to harvest volatility for income. And income is what living on your terms is about.
And its also sounds pretty cool to tell people: I sell lottery tickets for a living !