It does not matter when are you reading this. You can look at reddit threads today, or from a year ago, or from five years ago, and so on. The same nagging question is ever present.
TQQQ for example is a leveraged fund, and its volatility is legendary. Here was a latest rendering of it, when someone asked :
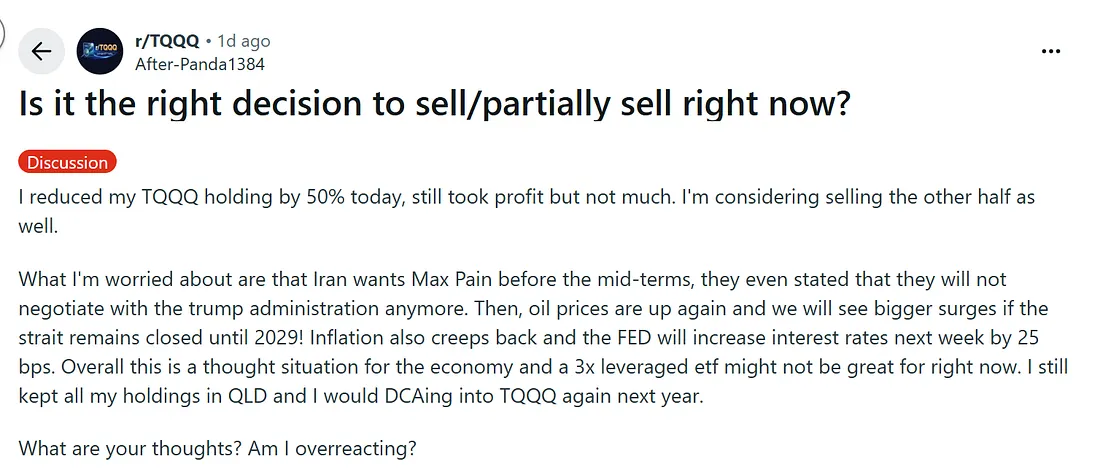
And here was the first comment. The very first one from TitanGodKing !
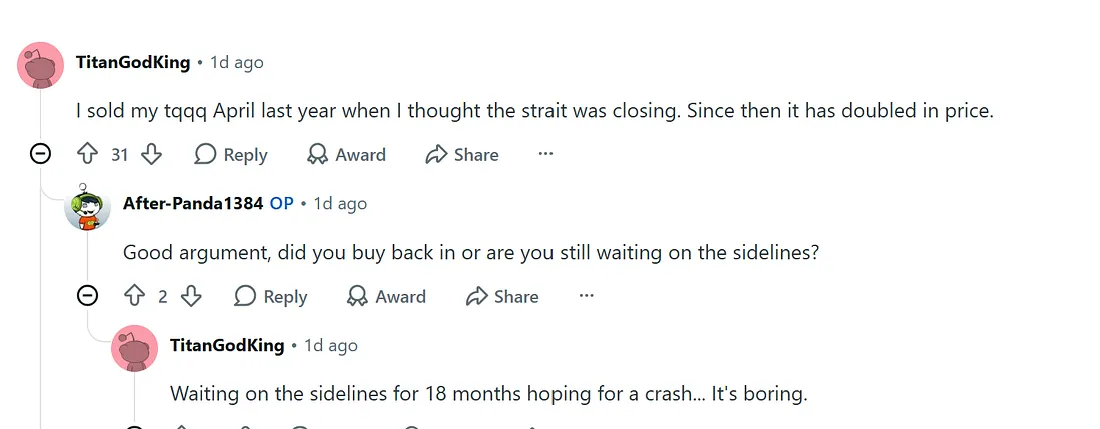
The very first comment
Doubled in price !!! Thats a nice roundup.
The selling fear is ever present, the meltdown fear is ever present, and the massive drawdown fear is every present. What is one to do amidst these fears ?
TQQQ has given a massive compounding result of over 30% per year, over the last 10+ years. Its an unbelievable compounding machine, for those who can stomach its volatility. What can you possibly do to stomach its volatility ?
The line
The compounding line is something that runs through the price history, and gives you a single image of how the asset has compounded over the last decade or two. It gives you a single image of how the asset has behaved. I drew this line for TQQQ, using the data from the last 15 years, starting 2011. Yes, yes, its post GFC, but hold on to your critique about selective data. We will come to it. We will examine why making that choice is rational.
So with that line, here is the result.
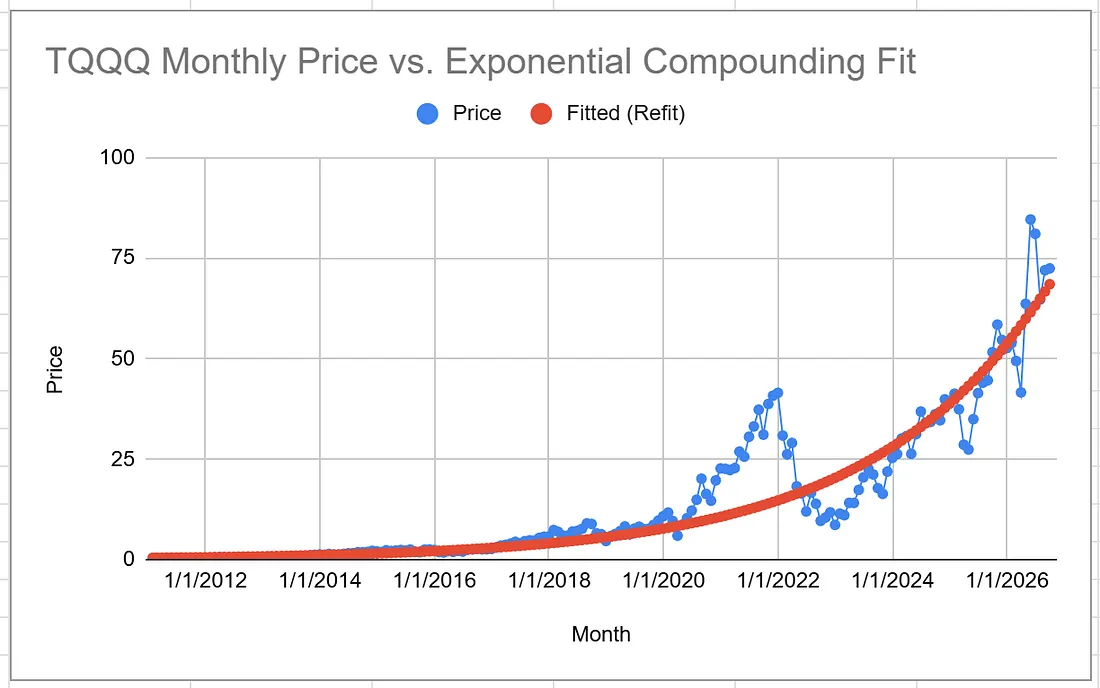
This is price point for every month, since the last 15 years, overlaid on top of a compounding line in red. Here is the first and the last price point on the line, just to give you an idea. (since the start is not even visible)
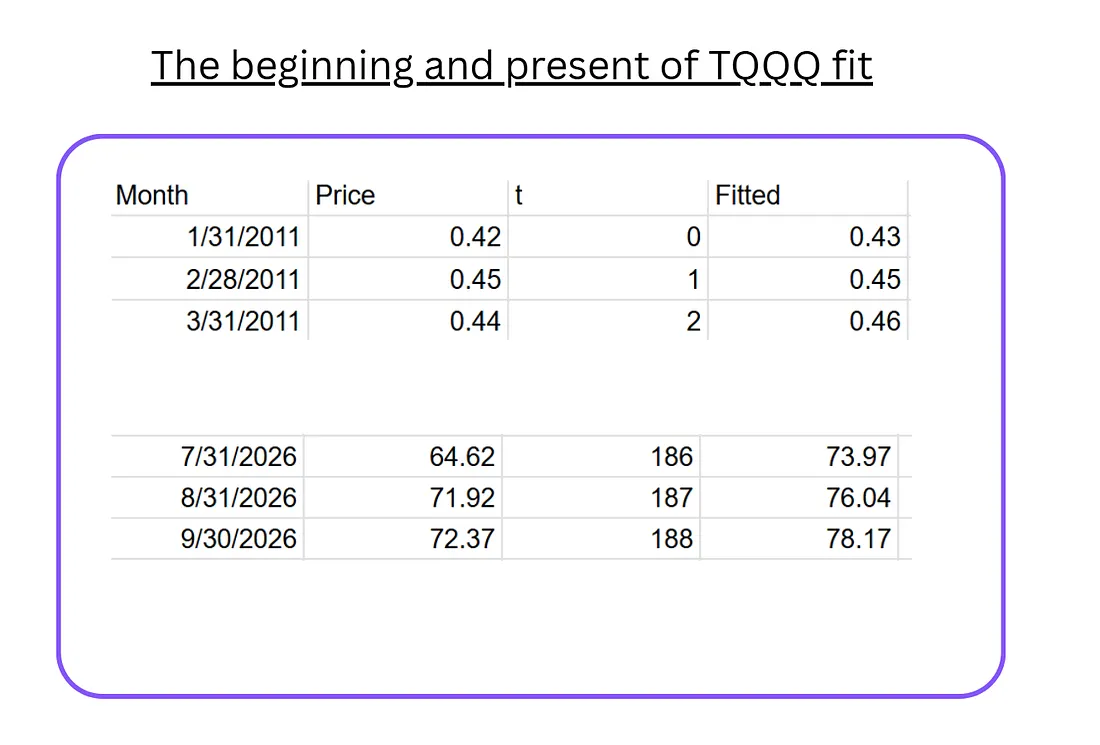
Notice how well the fitted line works over the start and end. Remember the fit considered every data point equally. And so the closeness to start (0.42, 0.43) and end (72, 78) is quite remarkable.
The divergence
We also see that the only real divergence happened during the post covid rush, (followed by the eventual correction) and then again, the price started hugging the exponential. Here is what I mean visually.
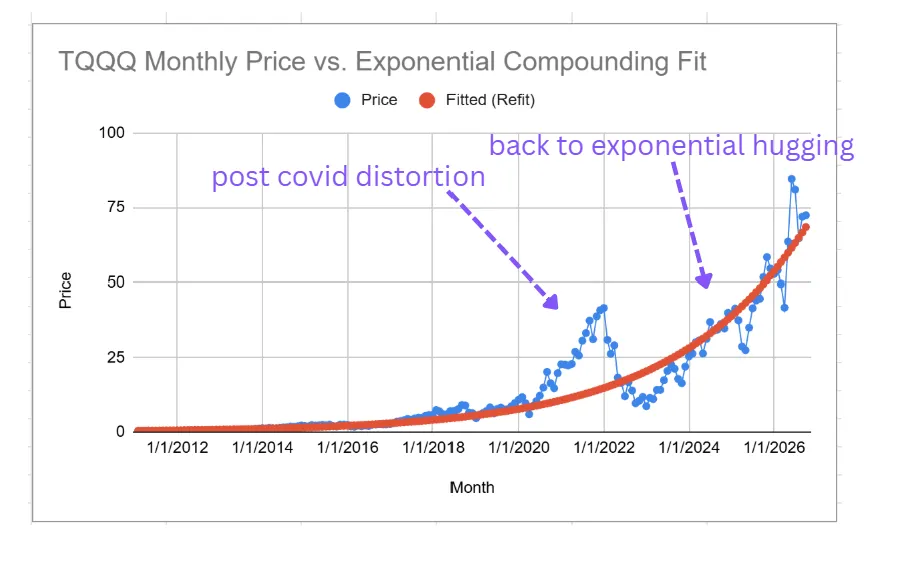
And so the correspondence to the exponential trend is quite strong.
The two sides to the exponential debate :
There is a side that would argue that this is a temporary exponential, and no exponential can go on forever.
And there could be an argument that this exponential represents the fundamental growth of human progress.
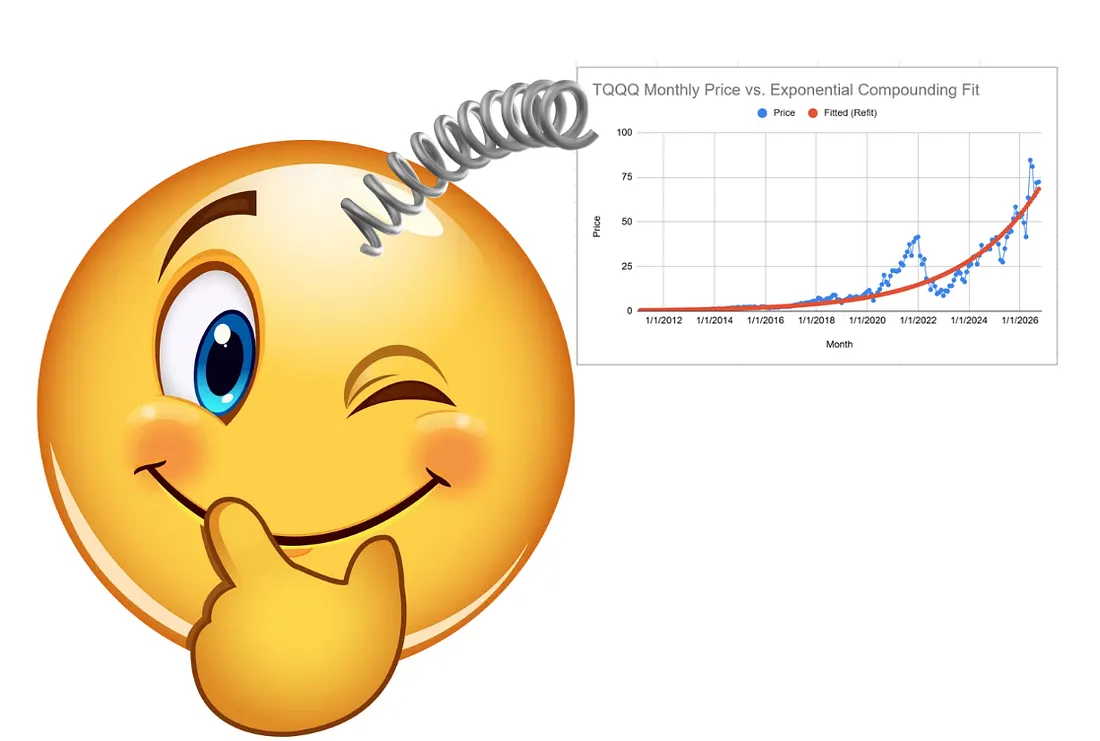
Which one is right ? Will this exponential go on forever, or will it end in a meltdown ?
I don’t know !
But …..
Before you close on me for making you read this far without an answer, here is the argument: Why should I care if this exponential lasts forever or not. Shouldnt I only care about riding the exponential, and be prepared to fall off it, when that happens !
Yes, ride the exponential for as long as it lasts, and then fall off it, without hurting yourself to death.
You must survive. That is paramount. Because from 500+ years of history, we know that humans make progress. Exponential progress many a times (after a big breakthrough). And so after the dust settles, there will be another exponential. You got to get up, dust off, and ride another one.
Whether the humanity falls off the AI cliff into annihilation this time around….. Dont expect anyone to know that… and dont put faith in anyone who claims to know.
So then the question becomes, what is the best way to ride an exponential, while being prepared to fall off.
The real question is : What is the best way to ride an exponential, with a safety gear in place.
And here is my way to frame it.
Riding Exponentials 101
How do you best ride an exponential, while being prepared to fall.
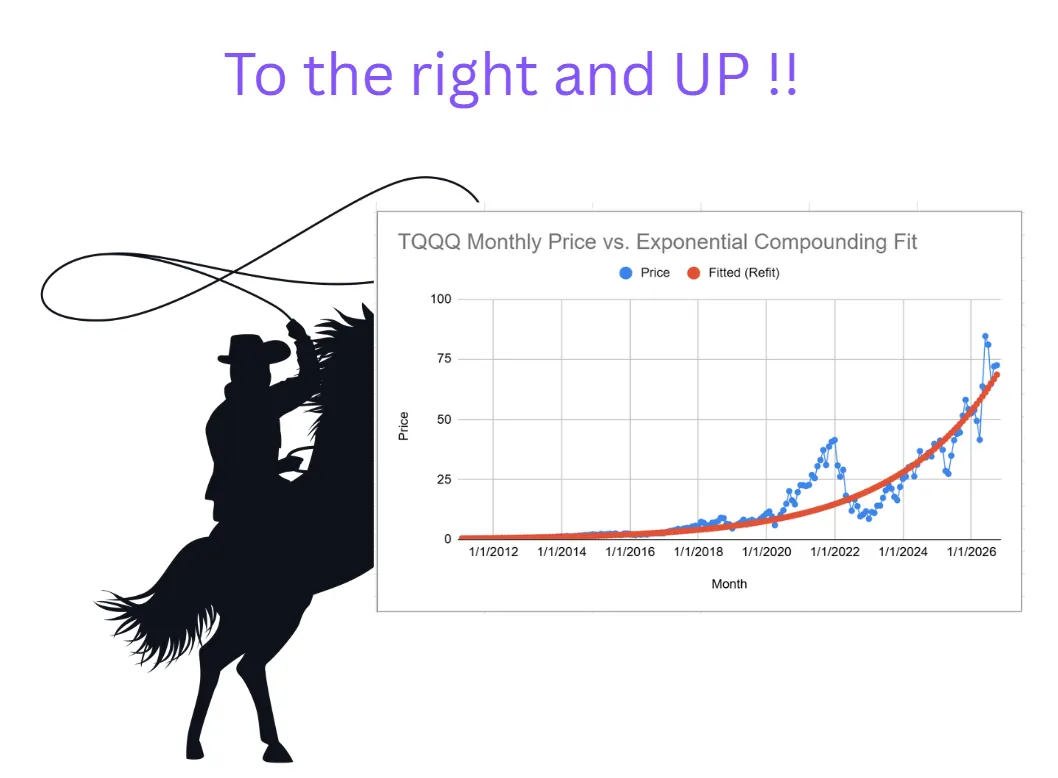
Well, the first thing is, you follow the exponential closely. How far are you from the trend ? Does that look too far ? Can you conclude that the exponential has come to an end ? So examining the exponential with all the intensity you can muster.
Let me show you what this practically means.
After having fitted the exponential, I plotted the residual. Residual is the error between the blue (data) and red (the trend).
This is how residual looks like.
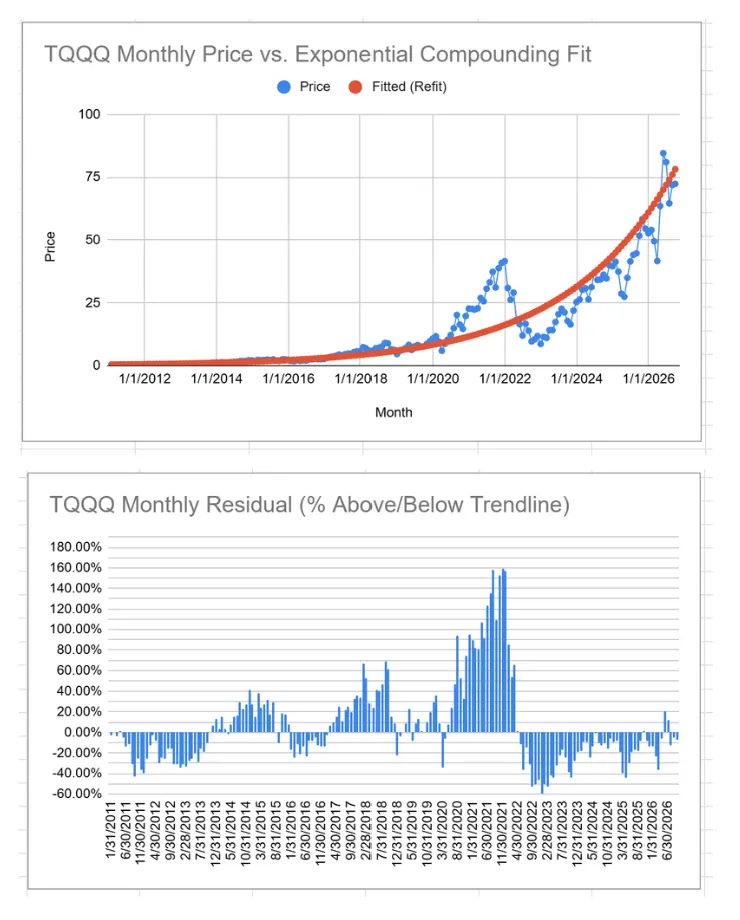
Notice how the residual before the covid era, remained comfortably below the 100% range, hovering around the max of 40’s and occasionally going to 60s. (60% of the predicted trend)
And this was the performance dashboard for the ticker:
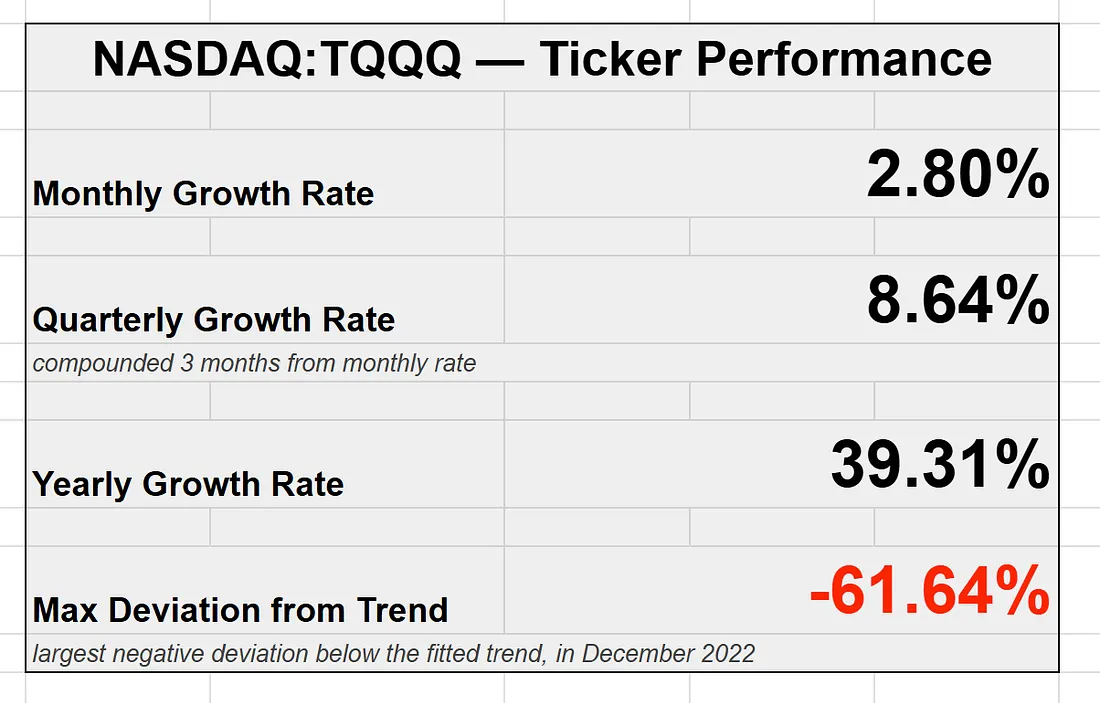
A monthly growth of 2.80%, leading to a yearly return of 39.31%. A max deviation of 61% from the trend.
And then we see how the covid was a bit of detachment from the usual. Having that data in the set could skew things. What if we could elimiate residuals above 80%. This is what we call robust fitting in statistics. In this situation, the outliers or extreme data points are filtered so that the line does not try and accomodate them in the fitting.
Here is how the red line transforms as a result, and the marked residuals which were eliminated.
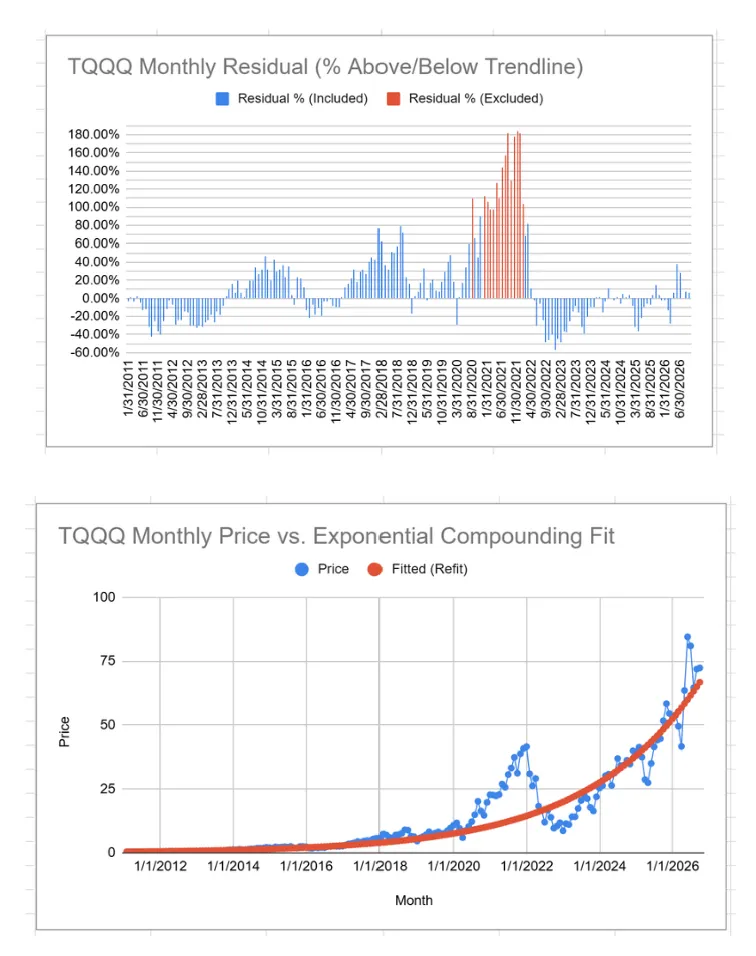
The red line has pulled down a little (even if you cant see that yet). Due to the elimination of very high positive residual points. Thats presumably good for our fit. So where does it leave our returns. Here is the summary result from our new fit.
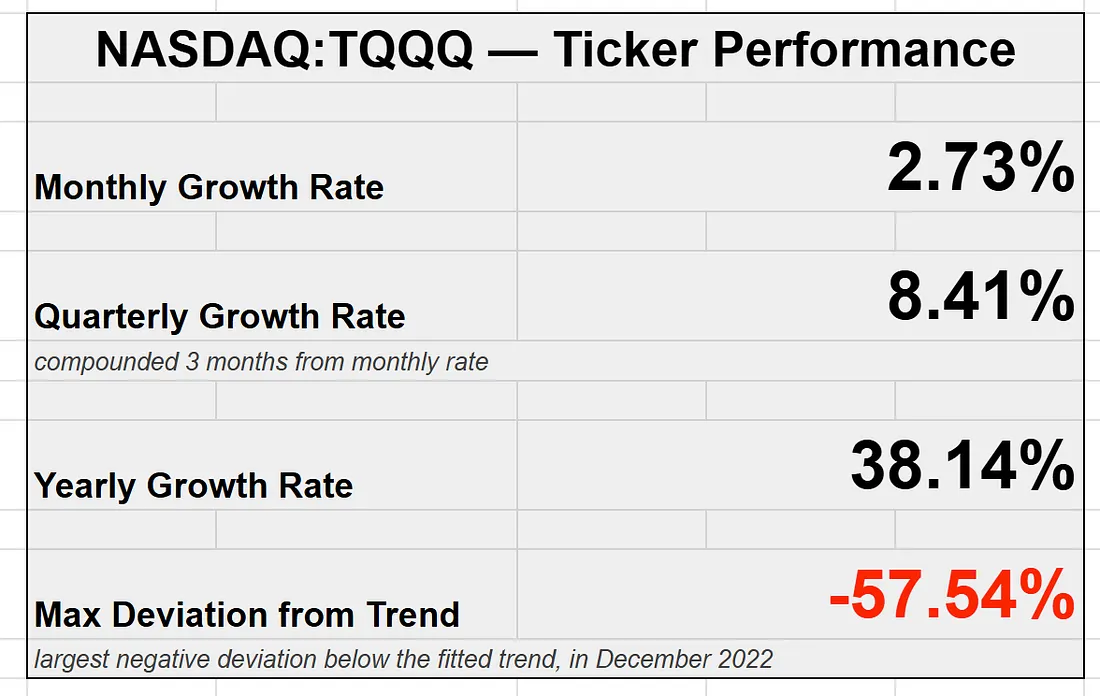
So we go from 39.3% a year, to 38.1% a year. This is a change of 1 percentage point in our cumulative return. This is good news. This tells us that even elimination of such a stark era as post covid, does not lead to too much variation in our CAGR. In other words, the pricing model was fairly robust as it stood. But certainly 38.14% is a better, slightly more reliable estimate of the underlying dynamics.
So where does it leave our current valuation ? And the decision to sell or not. The question we started with. The question was asked in September 2026, and here is the snapshot of the model for October 2026 price point.
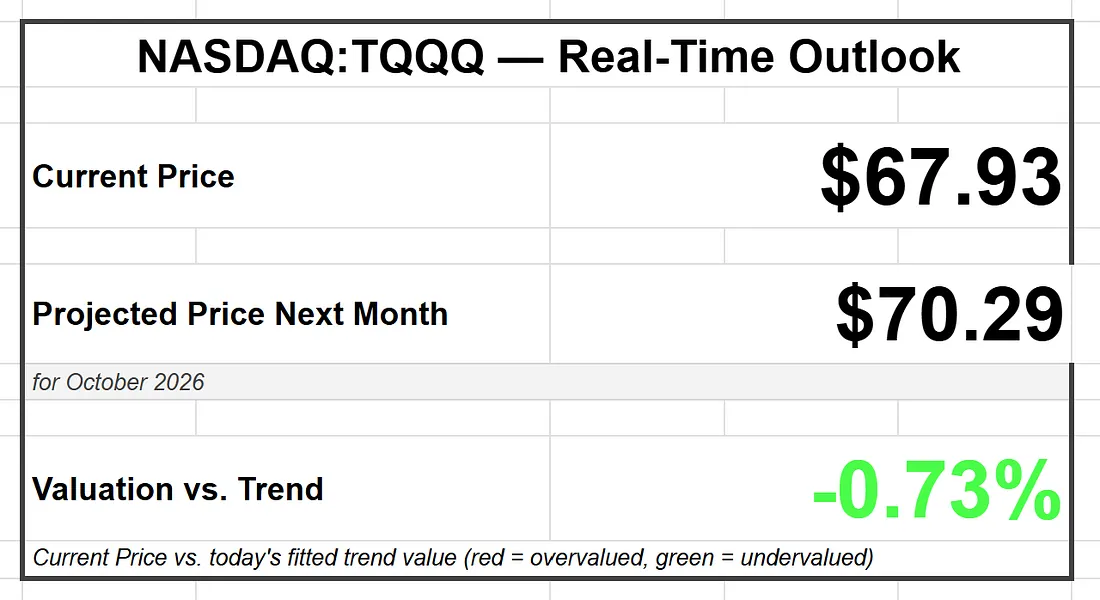
As we can see, we are nearly even with the current price. 15 years of compounding, and it shows no significant over or under valuation ! If anything, we are slightly in the green, meaning undervalued by less than a percentage point. However, since the monthly increase rate is 2.73%, this can be considered a wash (in the noise).
The news might sound alarming, but a simple model like this suggests that the compounding is really on schedule. Nothing amiss. No dramatic under/over valuation, the fear of which is wreaking havoc on people’s sleep, if you look at different reddits.
Yes, we are in the smack dab middle of the AI bubble, yes there is crazy infra structure spending happening around us, yes the news is hot and awash with AI led disruption, but….. what does the simple compounding trendline suggests ?
Answer : Its all happening in line with expectations !! Expectation, that has been inferred from 15 years of price data.
Riding the exponential means, paying close attention to where it is, at any given moment of time, and making up your mind in accordance with that. Thats the lesson 101.
What happens from here
Now at some point, the exponential will break. We can hit a very bad recession, a re pricing of the market, a change in geopolitical order, etc etc. Any number of wild guesses. Predicting them, is almost bound to fail. There is no geo-political or macro economic analyst out there with a score resembling anything marginally more than a coin toss. We have to keep this in mind, all the time. Every crisis brings around a winner, who seems clairvoyant in hind sight. And that winner then spends his remaining professional life predicting similar crises, which never come about to be. Thats what I have observed again and again and again, in my limited investing life.
At some point, some crisis will ensue.
But if “when the exponential breaks”, cannot possibly be seen in advance, with any degree of accuracy, What are we to do then ?
Ride the exponential, and be prepared to fall when it ends.
Being prepared to fall means, investing fractionally. Having some funds with us, which are not invested in the exponential. Which are on the side, waiting to be deployed. Very safe funds. When we are certain (from evidence) that the exponential has broken, only then does it make sense to bring that dry powder into action. And boy, will it compound from there like wild fire.
How do we know the exponential broke
But then how do we know that the exponential has broken for good ?
Residuals again.
Watch your residuals like a hawk. If your residuals skew to one side, and never flip to the other, that means you are no longer on the trend. A new regime has unfolded.
Here is an example.
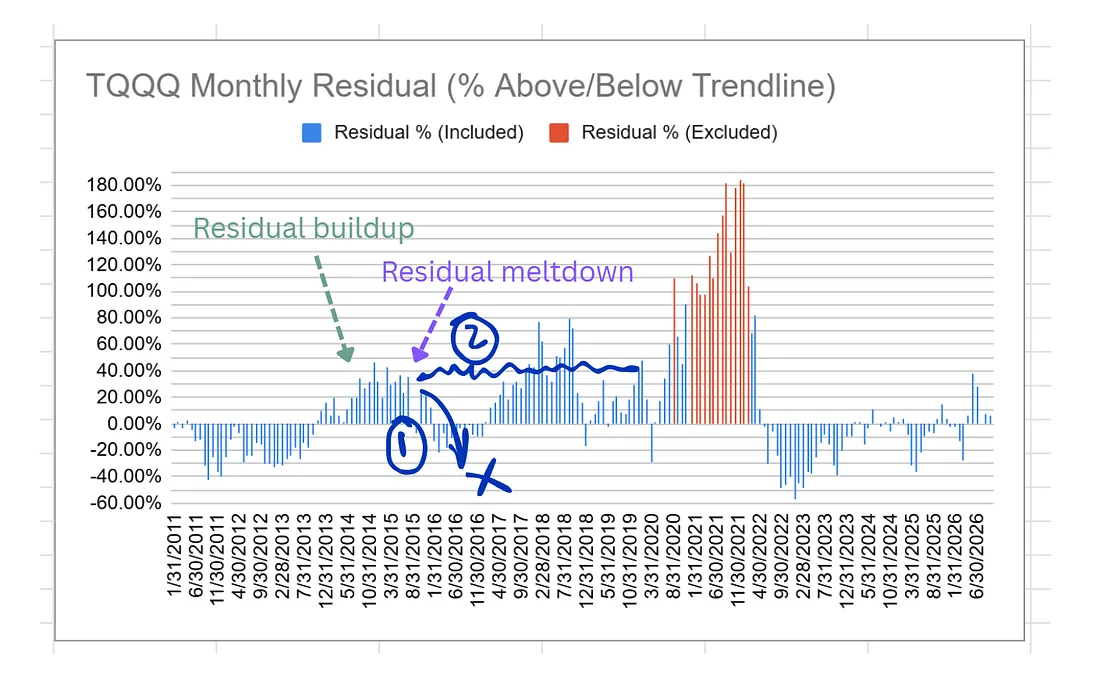
Notice how residuals build up, and then meltdown. Its a classic inflation deflation dynamics in play, brought out by visualization of residuals. People endlessly argue about one big bubble since 2010 going on and on. I dont see that. I see 3–4 bubbles already inflated and deflated from there to here. The big arc around those bubbles is the usual compounding dynamic. Not a bubble, as popular narrative reads. Just usual compounding. That exaggerates the bubble effect. But this compounding is what we have come to expect from indices, for possibly good reasons (last two decades have seen enormous leaps in technology and commerce).
Now once the residual has built up (on the rise), it has two options : To go down, or to continue in a flatlined way from there. 1) and 2) as marked on the figure. If the residual flatlines from there, that means the model has diverged. You are no longer catching the exponential. It has come to an end.
Whats the wait ? Look at the average time that the residual keeps going. Its anywhere from 5–15 months, before we have a mean reversion at this scale. Thats about as good an estimate as we can conjecture. Look for flat-lining over 5–15 months. If you find that residual is having a funny moment (of flat-lining), thats your signal. The model has broken, and a new trend will take its place (in due time). Remember, its not happening tomorrow. The wait might be another 10–15 years ! So dont hold your breadth over it. Just an FYI.
How to think of exponential reset
If something could be 10+ years away, why bother ? Because we have people with many different horizons. A 25 year old shouldnt care. And maybe decide to allocate 80 percent of investable assets to the exponential. A 45 year old ? Maybe not so. They might experience the reset in the next 10 years, and that could meaningfully impair their retirement plans. Their allocations need to be more strategic. 50% is not a bad option, for an exponential tearing ahead at 38% CAGR. A 65 year old can be slightly more prudent. Looking at the data, I would still not be sitting on the sidelines. AI is eating everything away. Creating a new world. Dismantling the old one. Disruption is in the air. You gotta be part of it. A 30% allocation sounds reasonable, if the rest of the portfolio can be in TBILs. With a 30% allocation, you could be decimated by 70%, and still only loose 20% of your holdings. And you still stand to have a significant gain, on the next run of the exponential. If you are aware, can notice the reset, and be disciplined enough to rebalance allocations for the next ride. (i-e rebalancing to 70–30 in the aftermath of the reset)
AI is disruptive. The world around us is changing. And there will be warning lights, and scary sirens , all around us, almost all the time. The trick is to filter the noise and lock on to the signal. Its a very very difficult job as an investor. Especially as a high beta, or leveraged investor. In times like this, the value of strightforward signals, and mental frameworks becomes evident. This piece here was supposed to provide one such framework. To think of the current compounding exponential, and its possible future paths. Hopefully it helps you in sitting tight through this exhilarating journey.
Happy riding!